Bioinformatics
We perform extensive primary, secondary, tertiary and quaternary protein structure analysis to use nature’s diversity in protein sequences to modify protein oligomerization and stability, optimize permeabilities and alter selectivity’s in a “bioinspired” way.
In vivo
We develop and establish cell growth and survival assays (yeast and E. coli) for high throughput screening of protein mutants as a pre-selection step ahead of the elaborate functional in vitro protein characterization.
In vitro
To create novel protein variants, we modify/mutate protein expression vectors using site directed mutagenesis by polymerase chain reaction (PCR). As a next step we optimize (i) expression in yeast or E. coli, (ii) protein purification via affinity chromatography and if necessary, size exclusion chromatography and (iii) reconstitution of these fluorescently labeled transmembrane wild-type and mutant proteins into large unilamelar vesicles (LUVs). Finally, accurate solute and solvent permeability quantification includes four major steps: (1) Determination of the reconstitution efficiency and the average number of proteins per proteoliposome (PL) by means of fluorescence correlation spectroscopy (FCS). (2) Estimation of the PL mean diameter as well as their size distribution with the help of photon correlation spectroscopy (PCS). (3) Solute and solvent permeability measurements using a stopped-flow device. (4) Data fitting, analysis and permeability calculations.
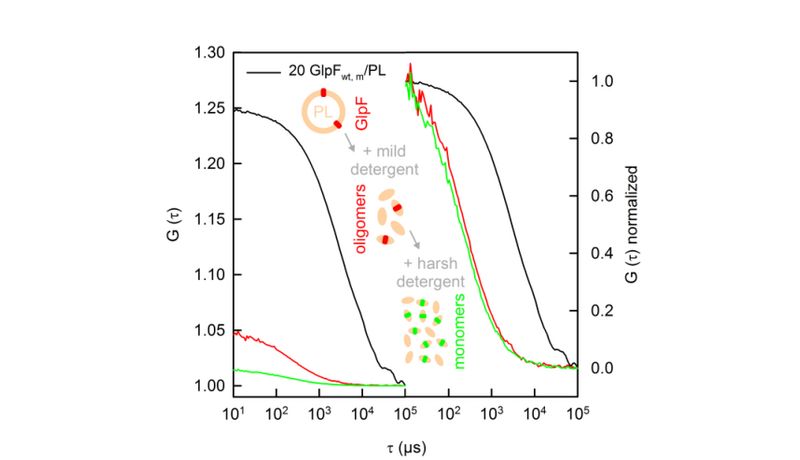
Protein counting with FCS (Fluorescence Correlation Spectroscopy)
Representative FCS autocorrelation curves of intact aquaporin containing vesicles (black), protein oligomer containing micelles after the addition of mild detergent (red) and depending on the protein, monomer containing micelles after the addition of harsh detergent (green). Normalized autocorrelation curves prove the formation of micelles after the addition of detergent to the PLs. The increased number of labeled protein-containing micelles after the addition of harsh detergent is recalculated to the number of protomers per oligomer. The comparison of the number of PLs with the total amount of lipid vesicles gives rise to the fraction of PL.
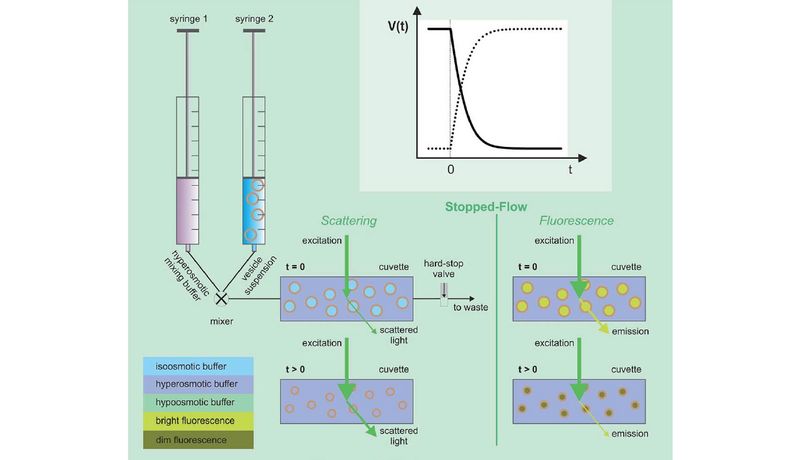
Protein characterization
Neutral solutes can be quantified using light scattering or fluorescence self-quenching.
Aquaporin containing liposomes subjected to a hyperosmotic solution in a stopped-flow apparatus at 5°C. The intensity of scattered light at 90° is monitored at a wavelength of 546nm. We calculate the vesicular water efflux from scattered light intensities via our new adaptation of the Rayleigh-Gans- Debye equation (red dashed lines). Water permeability increases with increasing amount of proteins per vesicle. In comparison to fluorescence self-quenching, scattering signals do not only depend on the vesicular volume change but also the accompanying change of refractive index of the vesicle interior.
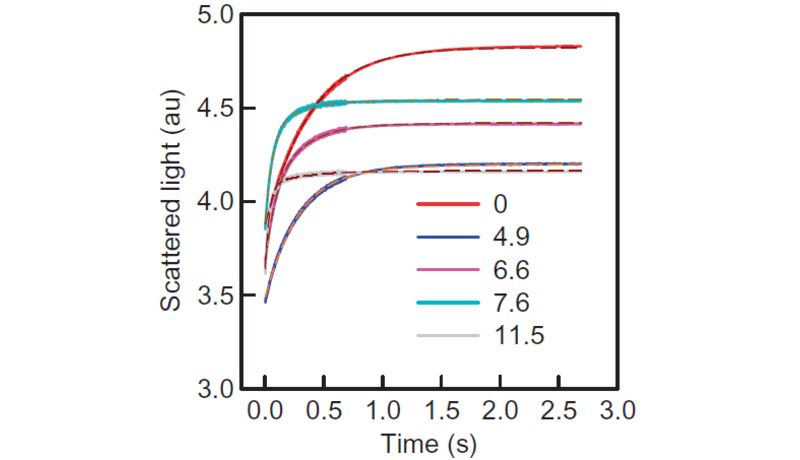
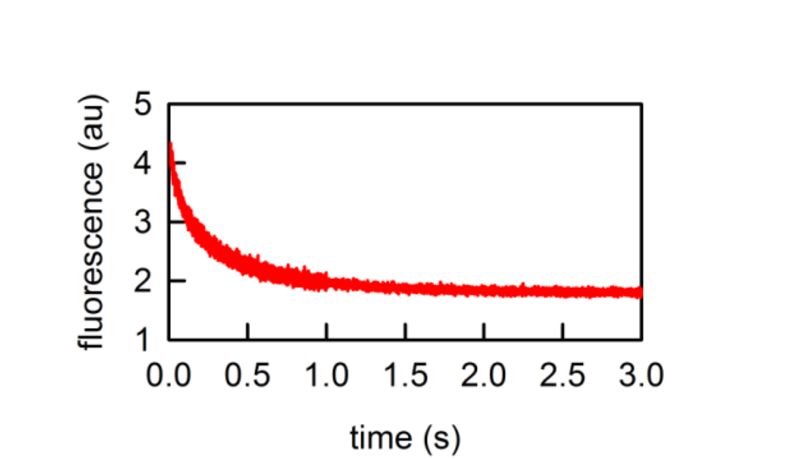
Weak acid or base permeability can be quantified using pH sensitive probes entrapped in the vesicle interior.
Fluorescence response due to ammonia efflux from carboxyfluorescein loaded vesicles. Ammonia efflux reduces the overall concentration of weak base in the vesicle and therefore releases protons, which in turn acidify the vesicles interior.
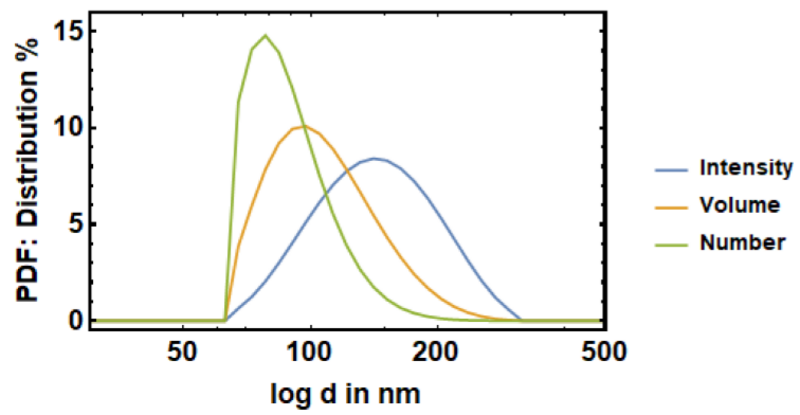
Vesicle size distribution estimation using dynamic light scattering (DLS), also called photon correlation spectroscopy (PCS).
The size distribution of lipid vesicles (e.g. extruded through 50nm polycarbonate filters) can be viewed as the probability density function of the scattering intensity I (blue), the volume V (orange) or the Number N (green). In conjunction with scattering intensities from the stopped flow device the intensity distribution function is used for permeability quantification.
Johannes Kepler Universität Linz
Altenberger Straße 69
4040 Linz, Österreich
 Zur JKU Startseite
